U.S. Geological Survey World Petroleum Assessment 2000
by the USGS World Energy Assessment Team
|
by the USGS World Energy Assessment Team
|
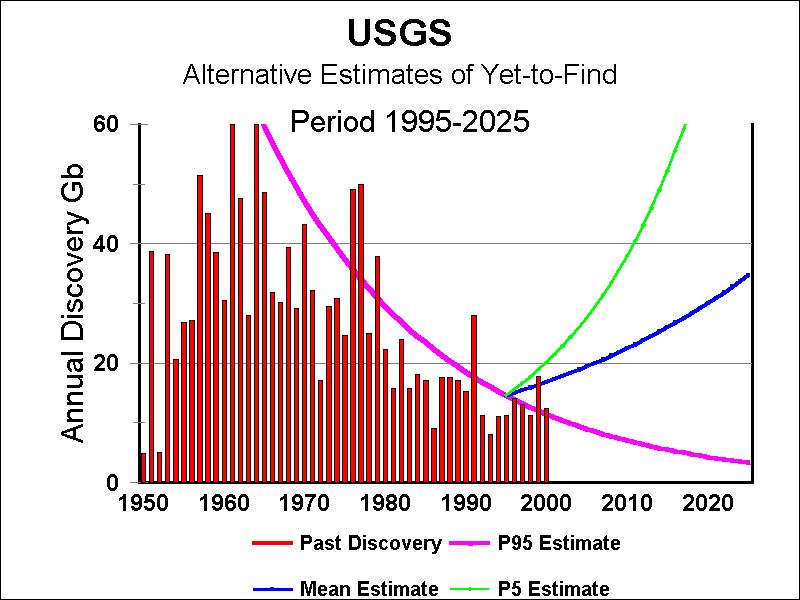
The above graph (http://greenwood.cr.usgs.gov/energy/WorldEnergy/DDS-60/ESpt6.html#Figure2) summarizes the USGS Assessment of Oil, gas and NGL resources. Following is commentary about the USGS report and some key reference data from the report.
It is important to make a distinction between petroleum reserves and resources. The USGS does not estimate petroleum reserves, those data come from commercially available databases like Petroconsultants. Petroleum reserves are known volumes of petroleum located in discovered fields but not yet produced. Resources are petroleum accumulations that are postulated to exist outside of known oil and gas fields; we used available geologic information and petroleum systems models to make those estimates.from an e-mail by Carolyn Bell, Public Affairs Specialist, U.S. Geological Survey, 7 July 2000
| Country | oil Gb | gas Tcf | condensate Gb | ||||||
|---|---|---|---|---|---|---|---|---|---|
| CP | RR | Undisc | CP | RR | Undisc | CP | RR | Undisc | |
| Saudi Arabia | 73 | 284 | 87 | 25 | 313 | 681 | 0,0 | 10,0 | 48,9 |
| Russia | 96 | 226 | 77 | 265 | 1676 | 1169 | 1,0 | 9,0 | 38,0 |
| Iran | 34 | 105 | 53 | 10 | 631 | 315 | 0,0 | 4,6 | 14,0 |
| Greenland | 0 | 0 | 47 | 0 | 0 | 81 | 0 | 0,0 | 4,2 |
| Brazil | 2 | 11 | 47 | 705 | 10 | 194 | 0,0 | 0,1 | 8,1 |
| Iraq | 22 | 100 | 45 | 5 | 75 | 120 | 0,0 | 0,2 | 6,2 |
| Nigeria | 16 | 33 | 38 | 6 | 90 | 123 | 0,0 | 2,8 | 5,6 |
| Kazakhstan | 4 | 18 | 21 | 1 | 70 | 72 | 0,2 | 5,7 | 3,6 |
| Mexico | 22 | 44 | 21 | 18 | 51 | 49 | 0,1 | 0,1 | 2,8 |
| Venezuela | 46 | 76 | 20 | 19 | 154 | 101 | 0,0 | 0,6 | 4,6 |
| Angola | 3 | 7 | 15 | 1 | 7 | 43 | 0,0 | 0,0 | 2,1 |
| Suriname | 0,017 | 0,063 | 13 | 0 | 0 | 36 | 0 | 0,0 | 2,0 |
| Norway | 9 | 22 | 13 | 15 | 111 | 183 | 0,2 | 2,9 | 9,9 |
| China | 24 | 48 | 12 | 10 | 44 | 86 | 0,0 | 0,3 | 4,5 |
| Libya | 14,2 | 38,9 | 8,3 | 5,5 | 56,7 | 21,1 | 0,0 | 0,3 | 0,9 |
| Gabon | 2,1 | 4,2 | 8,2 | 0,3 | 1,7 | 24,3 | 0,0 | 0,0 | 1,2 |
| Algeria | 9,1 | 18,3 | 7,7 | 5,8 | 178,7 | 49,0 | 1,0 | 6,8 | 2,1 |
| United Arab Emirates | 15,7 | 72,9 | 7,7 | 8,0 | 147,7 | 44,5 | 0,3 | 2,0 | 2,4 |
| Indonesia | 14,5 | 22,4 | 7,4 | 27,7 | 138,8 | 107,7 | 0,7 | 2,4 | 2,8 |
| Turkmenistan | 2,6 | 4,0 | 6,8 | 59,2 | 146,5 | 207,7 | 0,2 | 0,6 | 6,8 |
| United Kingdom | 13,3 | 22,9 | 6,3 | 42,5 | 100,5 | 23,4 | 0,3 | 3,7 | 0,8 |
| Azerbaijan | 9,2 | 13,6 | 6,3 | 5,4 | 17,3 | 67,4 | 0,2 | 0,3 | 2,9 |
| Falkland Islands (Islas Malvinas) | 0 | 0 | 5,8 | 0,0 | 0,0 | 16,6 | 0 | 0,0 | 0,4 |
| Congo | 0,9 | 2,5 | 5,8 | 0,0 | 2,3 | 17,4 | 0,0 | 0,0 | 0,8 |
| Colombia | 3,6 | 8,1 | 5,1 | 3,3 | 21,6 | 10,1 | 0,0 | 0,5 | 0,5 |
| Australia | 3,7 | 5,6 | 5,0 | 5,4 | 91,4 | 109,4 | 0,3 | 2,0 | 5,8 |
| Kuwait | 25,8 | 80,1 | 3,8 | 2,8 | 61,5 | 5,9 | 0,0 | 0,8 | 0,2 |
| Qatar | 5,0 | 9,2 | 3,6 | 2,9 | 371,9 | 41,1 | 0,0 | 10,7 | 1,8 |
| Oman | 3,6 | 7,3 | 3,5 | 1,3 | 33,2 | 33,7 | 0,0 | 0,7 | 1,8 |
| Peru | 2,0 | 2,7 | 3,3 | 2,0 | 3,0 | 6,3 | 0,0 | 0,0 | 0,3 |
| Yemen | 0,6 | 1,9 | 3,3 | 0,0 | 17,1 | 21,9 | 0,0 | 0,3 | 1,3 |
| Argentina | 4,3 | 6,6 | 3,2 | 15,6 | 46,1 | 36,7 | 0,2 | 0,7 | 0,9 |
| Egypt | 6,4 | 9,9 | 3,1 | 0,9 | 6,2 | 20,4 | 0,0 | 0,0 | 1,1 |
| Malaysia | 3,2 | 7,2 | 3,0 | 4,8 | 88,0 | 50,2 | 0,1 | 0,7 | 1,3 |
| Canada | 15,7 | 20,6 | 2,8 | 67,0 | 118,3 | 24,5 | 1,9 | 3,3 | 0,9 |
| India | 4,3 | 11,0 | 2,6 | 8,3 | 31,4 | 30,3 | 0,0 | 0,3 | 0,6 |
| Equatorial Guinea | 0 | 0,125 | 2,4 | 0,0 | 0,9 | 7,5 | 0,005 | 0,0 | 0,4 |
| Guyana | 0 | 0,000 | 2,2 | 0,0 | 0,0 | 6,0 | 0 | 0,0 | 0,3 |
| Tunisia | 1,0 | 1,5 | 2,2 | 0,6 | 3,7 | 7,1 | 0,0 | 0,1 | 0,3 |
| Brunei | 2,4 | 4,1 | 1,8 | 8,5 | 23,1 | 12,4 | 0,0 | 0,1 | 0,6 |
| Cameroon | 0,8 | 1,2 | 1,5 | 0,0 | 4,2 | 5,6 | 0,0 | 0,0 | 0,3 |
| Ukraine | 0,7 | 2,4 | 1,3 | 42,2 | 70,1 | 27,5 | 0,1 | 0,2 | 0,9 |
| Syria | 1,7 | 3,4 | 1,3 | 0,3 | 2,5 | 5,1 | 0,0 | 0,0 | 0,3 |
| Bolivia | 0,2 | 0,3 | 1,2 | 4,4 | 10,5 | 25,0 | 0,1 | 0,3 | 1,0 |
| Barbados | 0,008 | 0,011 | 1,2 | 0,0 | 0,0 | 9,0 | 0 | 0,0 | 0,4 |
| Romania | 4,3 | 6,3 | 1,1 | 24,3 | 38,2 | 5,4 | 0,0 | 0,0 | 0,1 |
| Ecuador | 2,0 | 5,4 | 1,0 | 0,5 | 1,6 | 0,6 | 0,0 | 0,0 | 0,0 |
| Paraguay | 0 | 0,000 | 0,9 | 0,0 | 0,0 | 4,5 | 0 | 0,0 | 0,2 |
| Bahrain | 0,9 | 0,0 | 0,9 | 4,7 | 12,5 | 16,5 | 0,0 | 0,1 | 0,7 |
| Sudan | 0 | 0,000 | 0,8 | 0,0 | 0,9 | 15,5 | 0 | 0,1 | 0,9 |
| Trinidad and Tobago | 2,7 | 3,3 | 0,8 | 3,2 | 22,0 | 31,8 | 0,0 | 0,2 | 1,2 |
| Turkey | 0,6 | 0,8 | 0,7 | 0,0 | 0,5 | 0,7 | 0,0 | 0,0 | 0,0 |
| Myanmar | 0,5 | 0,7 | 0,7 | 0,7 | 10,0 | 27,1 | 0,0 | 0,1 | 0,8 |
| Côte d' Ivoire | 0,1 | 0,1 | 0,6 | 0,0 | 1,7 | 6,0 | 0 | 0,0 | 0,2 |
| Eritrea | 0 | 0 | 0,6 | 0,0 | 0,0 | 10,9 | 0 | 0,0 | 0,6 |
| Cuba | 0,1 | 0,3 | 0,5 | 0,0 | 0,1 | 0,6 | 0 | 0,0 | 0,0 |
| Italy | 0,1 | 0,4 | 0,4 | 9,5 | 18,2 | 27,3 | 0,03 | 0,0 | 0,6 |
| Chile | 0,3 | 0,4 | 0,3 | 6,3 | 9,6 | 6,4 | 0,1 | 0,1 | 0,1 |
| Congo (Kinshasa) | 0,2 | 0,3 | 0,3 | 0,0 | 0,1 | 1,0 | 0 | 0,0 | 0,0 |
| Netherlands | 0,7 | 1,0 | 0,3 | 73,4 | 141,8 | 8,6 | 0,0 | 0,0 | 0,2 |
| France | 0 | 0 | 0,3 | 0,0 | 0,0 | 20,8 | 0 | 0,0 | 0,9 |
| Pakistan | 0,3 | 0,5 | 0,3 | 15,9 | 37,2 | 28,6 | 0,0 | 0,1 | 1,0 |
| Poland | 0,1 | 0,1 | 0,2 | 1,9 | 5,2 | 2,8 | 0 | 0,0 | 0,1 |
| Ghana | 0,003 | 0,050 | 0,2 | 0,0 | 0,2 | 2,0 | 0 | 0,0 | 0,1 |
| Germany | 1,6 | 1,9 | 0,2 | 22,6 | 33,9 | 13,0 | 0,0 | 0,0 | 0,1 |
| Uruguay | 0 | 0 | 0,1 | 0,0 | 0,0 | 1,1 | 0 | 0,0 | 0,1 |
| Hungary | 0,5 | 0,7 | 0,1 | 5,4 | 9,0 | 2,5 | 0,0 | 0,0 | 0,1 |
| Uzbekistan | 0,1 | 0,6 | 0,1 | 20,6 | 82,9 | 15,0 | 0,04 | 0,8 | 0,4 |
| Cambodia | 0 | 0,000 | 0,1 | 0,0 | 0,2 | 1,8 | 0 | 0,0 | 0,0 |
| Denmark | 0,5 | 1,3 | 0,1 | 2,0 | 9,6 | 0,8 | 0,1 | 0,2 | 0,0 |
| Thailand | 0 | 0 | 0,1 | 0,2 | 4,4 | 4,7 | 0,003 | 0,1 | 0,1 |
| Joint Thailand/Malaysia | 0 | 0 | 0,1 | 0,0 | 5,2 | 2,1 | 0 | 0,0 | 0,0 |
| Namibia | 0 | 0 | 0,1 | 0,0 | 0,0 | 1,5 | 0 | 0,0 | 0,1 |
| Afghanistan | 0 | 0,111 | 0,1 | 1,5 | 6,0 | 14,7 | 0,003 | 0,0 | 0,3 |
| Croatia | 0,6 | 0,8 | 0,1 | 0,7 | 3,7 | 1,7 | 0,0 | 0,1 | 0,0 |
| Spain | 0 | 0 | 0,1 | 0,0 | 0,0 | 17,8 | 0 | 0,0 | 0,8 |
| Benin | 0,019 | 0,030 | 0,1 | 0,0 | 0,1 | 0,7 | 0 | 0,0 | 0,0 |
| Australia/Indonesia | 0 | 0,021 | 0,1 | 0,0 | 6,0 | 4,5 | 0 | 0,4 | 0,2 |
| Senegal | 0 | 0,010 | 0,1 | 0,0 | 0,0 | 0,3 | 0 | 0,0 | 0,0 |
| Mauritania | 0 | 0,000 | 0,0 | 0,0 | 0,0 | 0,3 | 0 | 0,0 | 0,0 |
| Serbia and Montenegro | 0,2 | 0,3 | 0,0 | 0,2 | 1,2 | 0,3 | 0 | 0,0 | 0,0 |
| Vietnam | 0 | 0,000 | 0,0 | 0,0 | 0,0 | 0,8 | 0 | 0,0 | 0,0 |
| Guinea-Bissau | 0 | 0,000 | 0,0 | 0,0 | 0,0 | 0,2 | 0 | 0,0 | 0,0 |
| Bangladesh | 0,001 | 0,001 | 0,0 | 2,6 | 11,8 | 33,6 | 0,003 | 0,1 | 0,2 |
| Malta | 0 | 0,000 | 0,0 | 0,0 | 0,0 | 0,2 | 0 | 0,0 | 0,0 |
| South Africa | 0 | 0,000 | 0,0 | 0,0 | 0,0 | 2,1 | 0 | 0,0 | 0,1 |
| Togo | 0 | 0,003 | 0,0 | 0,0 | 0,0 | 0,3 | 0 | 0,0 | 0,0 |
| Western Sahara | 0 | 0,000 | 0,0 | 0,0 | 0,0 | 0,1 | 0 | 0,0 | 0,0 |
| French Guiana | 0 | 0,000 | 0,0 | 0,0 | 0,0 | 0,0 | 0 | 0,0 | 0,0 |
| Slovakia | 0 | 0,000 | 0,0 | 0,0 | 0,4 | 0,3 | 0 | 0,0 | 0,0 |
| Bulgaria | 0,038 | 0,046 | 0,0 | 0,2 | 0,2 | 0,0 | 0,001 | 0,0 | 0,0 |
| Czech Republic | 0,001 | 0,001 | 0,0 | 0,0 | 0,0 | 0,5 | 0 | 0,0 | 0,0 |
| The Gambia | 0 | 0,000 | 0,0 | 0,0 | 0,0 | 0,0 | 0 | 0,0 | 0,0 |
| Morocco | 0 | 0,000 | 0,0 | 0,0 | 0,0 | 0,1 | 0 | 0,0 | 0,0 |
| Austria | 0 | 0,000 | 0 | 0,1 | 0,2 | 0,1 | 0,001 | 0,0 | 0,0 |
| Bosnia- | 0 | 0,001 | 0 | 0,0 | 0,0 | 0,0 | 0 | 0,0 | 0,0 |
| Grenada | 0 | 0,000 | 0 | 0,0 | 0,0 | 0,8 | 0 | 0,0 | 0,0 |
| Jordan | 0 | 0,000 | 0 | 0,0 | 0,2 | 2,4 | 0 | 0,0 | 0,2 |
| Kuwait/Saudi Arabia Neutral | 5,1 | 13,5 | 0 | 0,9 | 11,7 | 0,0 | 0,0 | 0,1 | 0,0 |
| Moldova | 0 | 0,002 | 0 | 0,0 | 0,0 | 0,0 | 0 | 0,0 | 0,0 |
| Slovenia | 0,005 | 0,006 | 0 | 0,0 | 0,1 | 0,0 | 0,001 | 0,0 | 0,0 |
View a table which provides totals for the above data, and also a more detailed summary by region of the Report derived from a spreadsheet which can be downloaded from http://energy.cr.usgs.gov:8080/energy/WorldEnergy/weppdf/sumworld.xls.
"...[I]f you read the results carefully, you will see that our views are really a mixture of optimism in some parts of the world, such as off the southwest coast of Africa or off the eastern coast of South America, and pessimism in other places, such as the low potential for future gas discoveries in regions like the Alberta Basin in Canada or future oil discoveries in Mexico. Also, we think that there is far less petroleum to be found in China than previously thought. Our estimates of 20% more oil and 14% less gas are relative to our last study, not necessarily to all other studies. Actually, we consider our estimates to be quite conservative, since we only assessed conventional resources, and did not assess tar sands, oil shale, heavy oil, gas hydrates, coal-bed methane, continuous gas or other biogenic gas resources."We have documented our methodology and our assumptions extensively so that the reader may trace our steps and draw their own conclusions. There are other individuals and groups who make predictions regarding the remaining petroleum endowment of the world. You might like to investigate their methods and results as well. It is always difficult to make meaningful comparisons of disparate studies because they have different goals and employ different methods. Some estimate peak production using production history; we estimate the volume of undiscovered oil and gas using a petroleum systems approach. Our analysis requires extensive geologic framework information, which we provide in our CD's, to generate hypothetical field size distributions.
"Our new assessment looks about 30 years into the future, so we should see within a decade if we are about on track. Keep in mind that no one can predict the future, all we can do is state our assumptions, explain our methodology, and make our forecast. It is not surprising that there are many different predictions and we will not know which one is close to the truth until we can look back on this time period as history."
further comments from e-mail by Carolyn Bell, Public Affairs Specialist, U.S. Geological Survey, 7 July 2000