Production and Consumption in 2004

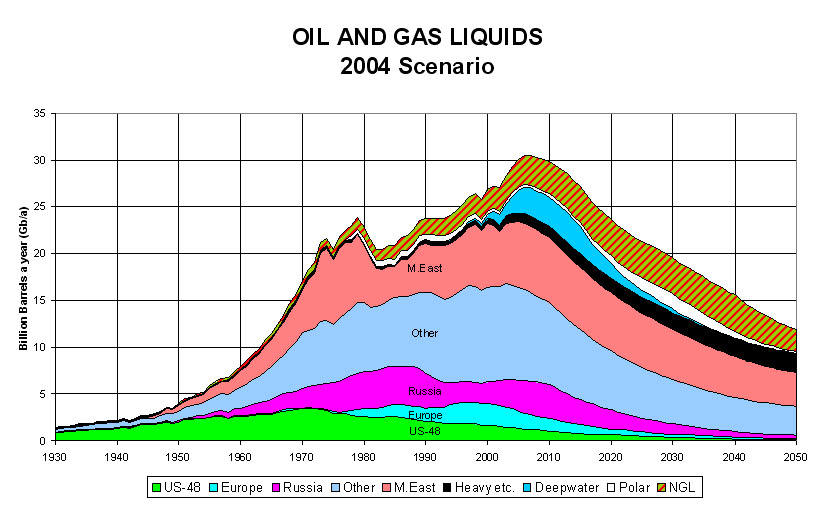
Oil Production and Consumption for Certain Countries

These graphs show the relative oil "production" and oil demand amongst certain countries whose strategic interests may be in conflict. Time will tell.

Oil Production and Consumption, USA
The USA remains by far the largest oil consumer with declining domestic production now meeting considerably less than 50% of consumption.
Oil Production and Consumption, China
China became a net importer in 1993 and is now on a trajectory to compete with the USA for remaining reserves around the world.
Oil Production and Consumption, United Kingdom Oil Production and Consumption, India Oil Production and Consumption, Indonesia
While still producing more than consumed, the UK's net-exporting days are numbered. Never an exporter, India's oil appetite is increasing at growth rates (4%-7%/year) nearly as high as China (5%-7%/year). In 2004, OPEC member Indonesia became a net importer! This was evident at the end of 2003.

Oil Consumption (red) and Production (black). Figures are in millions of barrels per day

Projected Oil and Gas Liquids, 2004 Scenario

Global oil production is rapidly approaching its peak, even if natural gas liquids and expensive, destructive, risky deepwater and polar oil are included.

Country charts [more, xls] are based on data from Statistical Review of World Energy, Full Report Workbook 2004. More data is available from BP at BP Statistical Review website.

Oil and Gas Liquids, 2004 Scenario, by Colin J. Campbell

Here's something else to contemplate -- a disturbing trend that is a reflection of the realities shown above:

Yen to dollars
Yen to Dollar
Euro to dollars
Euro to Dollar
Oil Production and Consumption, Iran
Iran is increasingly industrialized and uses more of its oil than in years gone by.
revised 2005 March 10
revised 2005 February 13
revised 2005 January 26
original 2005 January 20
© 1994-2011 • Ecotopia
contact info