| Forecasts of Future Oil Output | |
|---|---|
On this page are several graphs representing the predictions of future oil consumption by various stakeholders in the international debate. Which ones of these graphs are believable? Click on name of author or agency to obtain details of their respective projections of growth or decline in global oil consumption.
|
Hubbert, 1971
World Oil, from Energy and Power 
|
|||
|---|---|---|---|
|
US EIA, 2004 Long-Term World Oil Supply Scenarios 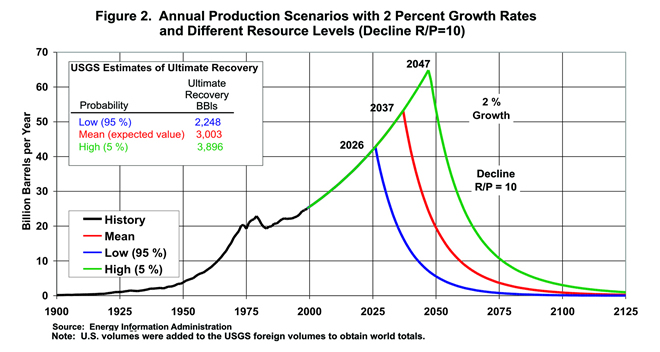 From "Long-Term World Oil Supply Scenarios: The Future Is Neither as Bleak or Rosy as Some Assert" by John H. Wood, Gary R. Long, David F. Morehouse. This defense of an earlier forecast by EIA is quite extraordinary. What absurd future can this graph possibly depict? Can the global consumption of oil double or triple over the next couple of decades and then drop at 10% per year? What kind of world would that be? Hang onto your hats, this is going to be a wild ride! | |||
|
Campbell, 1997
Production Scenarios 
|
Duncan, 1997
Global Output and AMPEC Output 
|
||
|
Ivanhoe, 1997 World Oil Supply 
|
Laherrere, 1997
World's Liquid Production 
|
||
|
Chevron, 1998 Oil Demand Outlook 
|
Shell, 1997
[link to reference no longer available] Dematerialisation Energy Demand Scenario 
|
||
|
EIA, 2001
World Oil Consumption 1970-2020 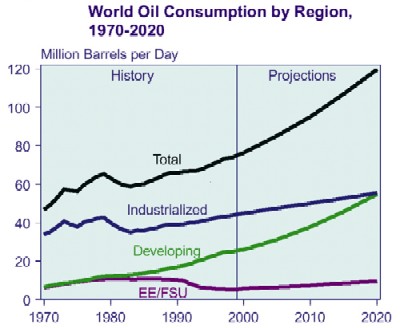
|
International Energy Agency, 1998 World Energy Prospects to 2020 
|
||
|
Campbell, 2003
The Growing Gap 
|
Campbell, 2004 All Hydrocarbons 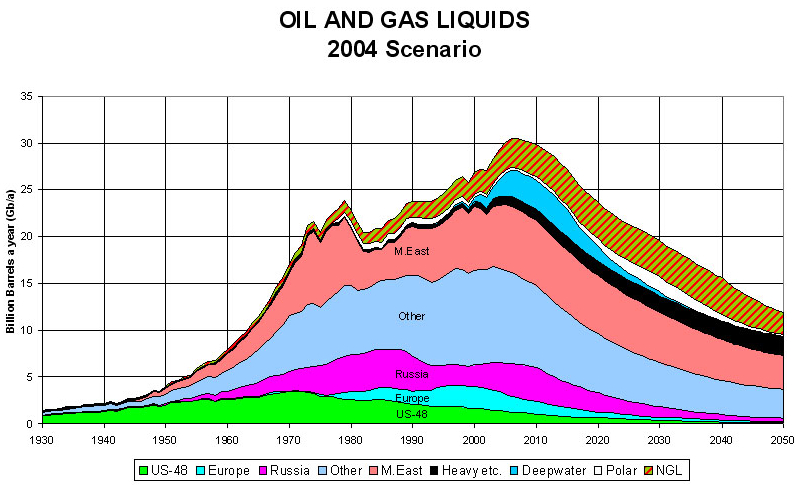
|
||
Often people ask about the key differences between various scenarios. The geologists and engineers illustrate the rise, peak and decline of oil. The oil companies and governments draw a rising graph, never depicting peak nor decline. One must ask, "Which approach has integrity?"
updated 2004 September 6